
折线图BrokenLine
一、效果总览
二、描述
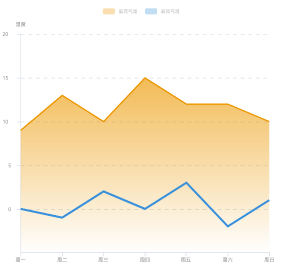
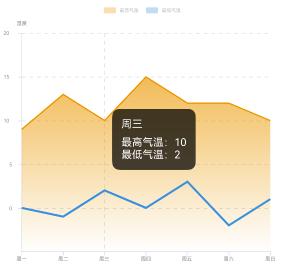
折线图
使用场景
适用于需要折线图的场景。
三、构造函数及参数说明
typescript
@Component
export struct OmniLineChart {
  private drawViewModel?: DrawBaseViewModel<LineDataType>
  @Prop @Watch('onCountUpdated') options: Options<LineDataType>;
  @State chartOption: OptionInterface<LineDataType> = {};
  @State renderType: string = 'init'
  private click: Function = (event: InterfaceObj, params: InterfaceObj) => {
  }
  private tooltipClick: Function = (event: InterfaceObj, params: InterfaceObj) => {
  }
  @BuilderParam customTooltip: (tooltipInfo: InterfaceObj) => void = globalBuilder
}
OmniLineChart
| 参数名 | 参数类型 | 描述 | 是否必填 | 默认值 |
|---|---|---|---|---|
| options | Options | 折线图的数据和样式 | 否 | null |
| click | Function | 图表点击事件的回调 | 否 | 空实现 |
| drawViewModel | DrawBaseViewModel | 折线图绘制逻辑类 | 否 | new DrawLineViewModel() |
| customTooltip | Function | 自定义tooltip时的点击回调 | 否 | 图表库自动生成默认值 |
四、代码演示
typescript
@Component
export struct OmniLineChartExamplePage {
  @State defOption: Options<LineDataType> = new Options({
    xAxis: {
      type: 'value',
      data: ['周一', '周二', '周三', '周四', '周五', '周六', '周日'],
    },
    yAxis: {
      type: 'category',
      name: '温度'
    },
    series: [
      {
        name: '最高气温',
        lineStyle: {
          width: 1.5
        },
        areaStyle: {
          color: {
            direction: [0, 0, 0, 1],
            colors: ['#00f39c12', '#fff39c12']
          }
        },
        color: '#fff39c12',
        data: [9, 13, 10, 15, 12, 12, 10]
      },
      {
        name: '最低气温',
        lineStyle: {
          width: 2.5
        },
        color: '#ff3498db',
        data: [0, -1, 2, 0, 3, -2, 1]
      },

    ]
  })
  build() {
    NavDestination() {
      Column() {
        OmniLineChart({
          options: this.defOption,
        })
      }
      .height('50%')
    }
    .title('折线图示例')
  }
}