Write a dynamic data chart
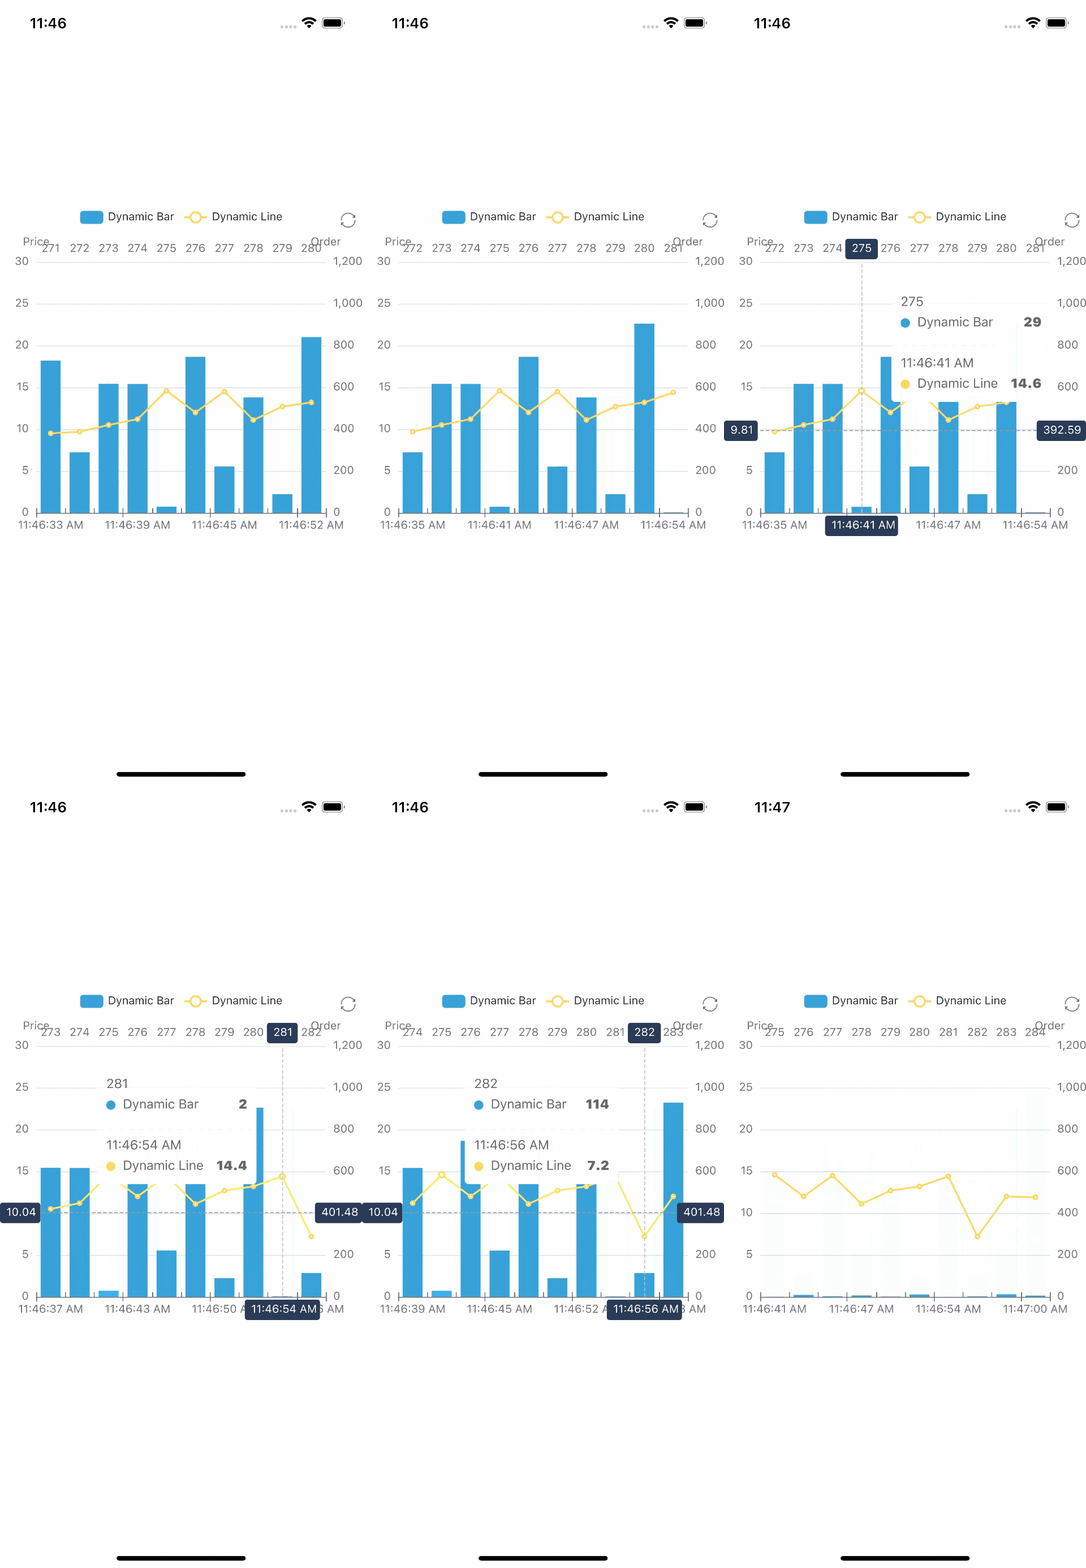
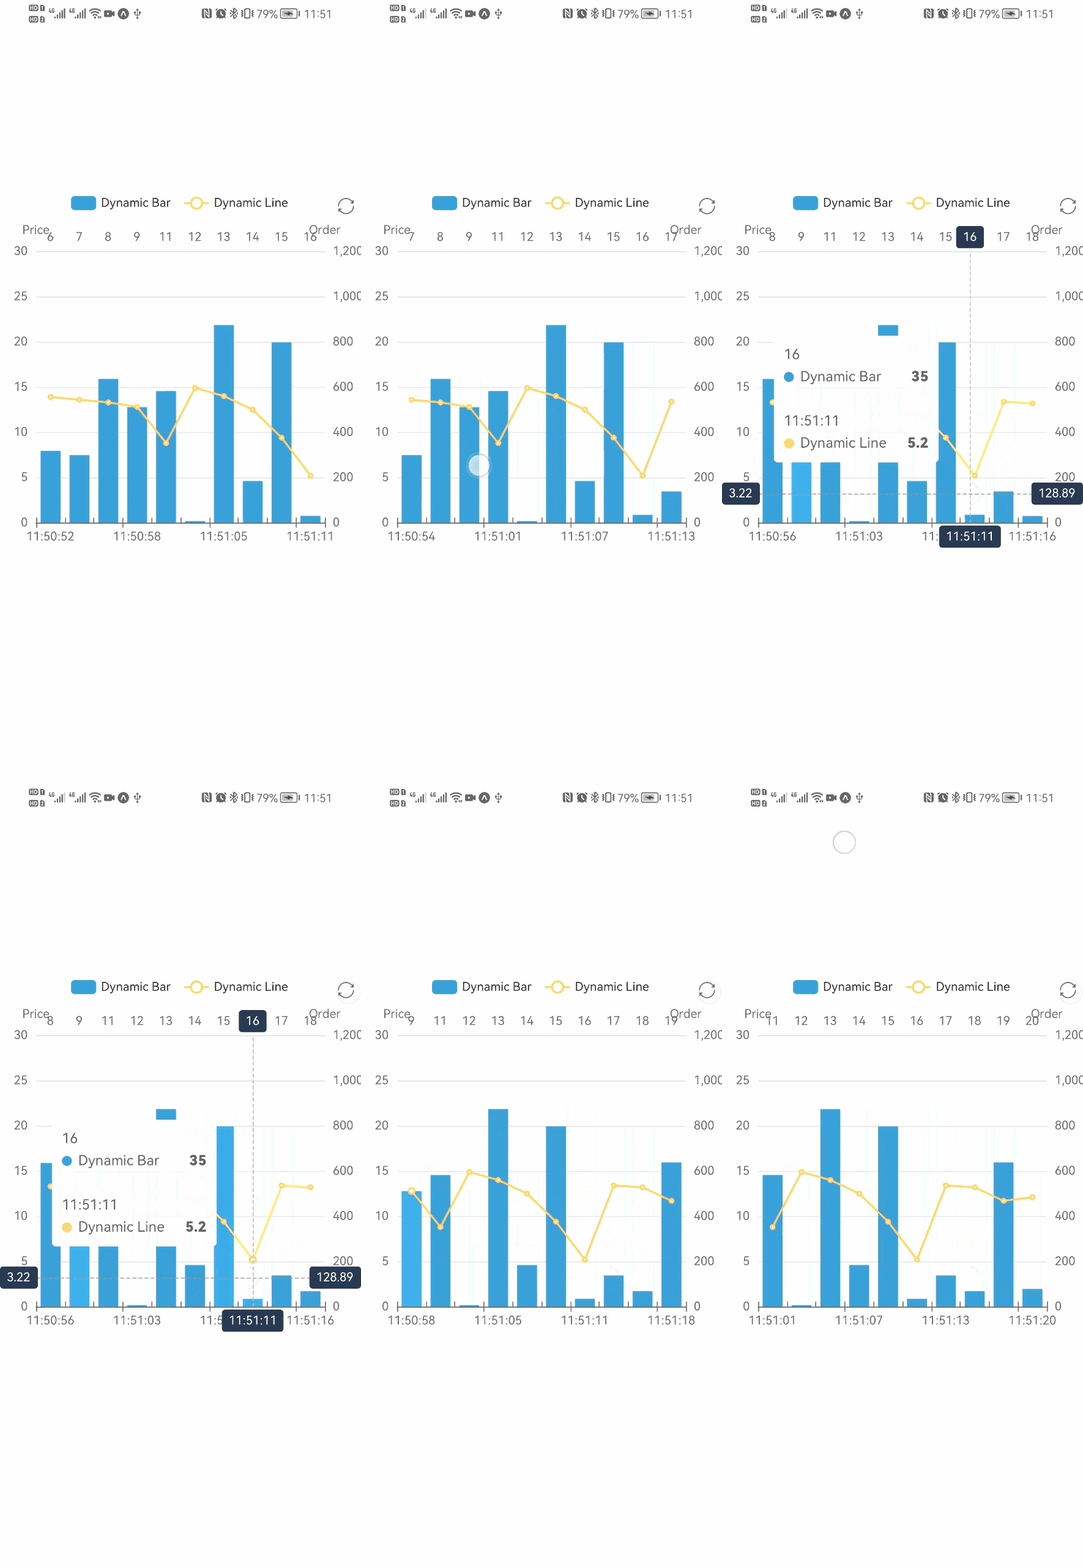
we try to draw a chart showing dynamic data changes with Svg mode, containing bar and line charts. It works on the browser side here。
- first, import the chart dependencies as in the previous case.
the bar chart needs to be imported into BarChart, and the rest of the components used include ToolboxComponent, ToolboxComponent, TooltipComponent, LegendComponent, DataZoomComponent.
import { BarChart } from 'echarts/charts';
import {
  ToolboxComponent,
  LegendComponent,
  TooltipComponent,
  DataZoomComponent,
} from 'echarts/components';
import { SVGRenderer, SvgChart } from '@wuba/react-native-echarts';
if you are not sure what components to import, you can refer to here if you encounter error reports.
- use echarts.use to register the renderer and chart.
echarts.use([
  SVGRenderer,
  BarChart,
  ToolboxComponent,
  TooltipComponent,
  LegendComponent,
  DataZoomComponent,
]);
- create a ref for the SvgChart.
export default function App() {
  const svgRef = useRef<any>(null);
  return <SvgChart ref={svgRef} />;
}
- writing options and data switching functions.
const categories = (function () {
  let now = new Date();
  let res = [];
  let len = 10;
  while (len--) {
    res.unshift(now.toLocaleTimeString().replace(/^\D*/, ''));
    now = new Date(+now - 2000);
  }
  return res;
})();
const categories2 = (function () {
  let res = [];
  let len = 10;
  while (len--) {
    res.push(10 - len - 1);
  }
  return res;
})();
const data = (function () {
  let res = [];
  let len = 10;
  while (len--) {
    res.push(Math.round(Math.random() * 1000));
  }
  return res;
})();
const data2 = (function () {
  let res = [];
  let len = 0;
  while (len < 10) {
    res.push(+(Math.random() * 10 + 5).toFixed(1));
    len++;
  }
  return res;
})();
const option = {
  tooltip: {
    trigger: 'axis',
    axisPointer: {
      type: 'cross',
      label: {
        backgroundColor: '#283b56',
      },
    },
  },
  legend: {},
  toolbox: {
    show: true,
    feature: {
      dataView: { show: false, readOnly: false },
      restore: {},
    },
  },
  dataZoom: {
    show: false,
    start: 0,
    end: 100,
  },
  xAxis: [
    {
      type: 'category',
      boundaryGap: true,
      data: categories,
    },
    {
      type: 'category',
      boundaryGap: true,
      data: categories2,
    },
  ],
  yAxis: [
    {
      type: 'value',
      scale: true,
      name: 'Price',
      max: 30,
      min: 0,
      boundaryGap: [0.2, 0.2],
    },
    {
      type: 'value',
      scale: true,
      name: 'Order',
      max: 1200,
      min: 0,
      boundaryGap: [0.2, 0.2],
    },
  ],
  series: [
    {
      name: 'Dynamic Bar',
      type: 'bar',
      xAxisIndex: 1,
      yAxisIndex: 1,
      data: data,
    },
    {
      name: 'Dynamic Line',
      type: 'line',
      data: data2,
    },
  ],
};
- create a chart instance and set the option.
let chart = echarts.init(svgRef.current, 'light', {
  renderer: 'svg',
  width: E_WIDTH,
  height: E_HEIGHT,
});
chart.setOption(option);
- after the instance is created, the data is updated periodically to achieve the animation.
let count = 11;
inter = setInterval(function () {
  let axisData = new Date().toLocaleTimeString().replace(/^\D*/, '');

  data.shift();
  data.push(Math.round(Math.random() * 1000));
  data2.shift();
  data2.push(+(Math.random() * 10 + 5).toFixed(1));

  categories.shift();
  categories.push(axisData);
  categories2.shift();
  categories2.push(count++);

  chart.setOption({
    xAxis: [
      {
        data: categories,
      },
      {
        data: categories2,
      },
    ],
    series: [
      {
        data: data,
      },
      {
        data: data2,
      },
    ],
  });
}, 2100);
- use useEffect to make sure the chart is initialized only once. Don't forget to dispose the chart and clear the timer when the component is unmounted.
useEffect(() => {
  return () => {
    chart?.dispose();
    clearInterval(inter);
  };
}, []);
That's it! Here is the code:
import { useRef, useEffect } from 'react';
import * as echarts from 'echarts/core';
import { Dimensions, StyleSheet, View } from 'react-native';
import { BarChart } from 'echarts/charts';
import {
  ToolboxComponent,
  LegendComponent,
  TooltipComponent,
  DataZoomComponent,
} from 'echarts/components';
import { SVGRenderer, SvgChart } from '@wuba/react-native-echarts';

echarts.use([
  SVGRenderer,
  BarChart,
  ToolboxComponent,
  TooltipComponent,
  LegendComponent,
  DataZoomComponent,
]);

const E_HEIGHT = 400;
const E_WIDTH = Dimensions.get('screen').width;

const categories = (function () {
  let now = new Date();
  let res = [];
  let len = 10;
  while (len--) {
    res.unshift(now.toLocaleTimeString().replace(/^\D*/, ''));
    now = new Date(+now - 2000);
  }
  return res;
})();
const categories2 = (function () {
  let res = [];
  let len = 10;
  while (len--) {
    res.push(10 - len - 1);
  }
  return res;
})();
const data = (function () {
  let res = [];
  let len = 10;
  while (len--) {
    res.push(Math.round(Math.random() * 1000));
  }
  return res;
})();
const data2 = (function () {
  let res = [];
  let len = 0;
  while (len < 10) {
    res.push(+(Math.random() * 10 + 5).toFixed(1));
    len++;
  }
  return res;
})();
const option = {
  tooltip: {
    trigger: 'axis',
    axisPointer: {
      type: 'cross',
      label: {
        backgroundColor: '#283b56',
      },
    },
  },
  legend: {},
  toolbox: {
    show: true,
    feature: {
      dataView: { show: false, readOnly: false },
      restore: {},
    },
  },
  dataZoom: {
    show: false,
    start: 0,
    end: 100,
  },
  xAxis: [
    {
      type: 'category',
      boundaryGap: true,
      data: categories,
    },
    {
      type: 'category',
      boundaryGap: true,
      data: categories2,
    },
  ],
  yAxis: [
    {
      type: 'value',
      scale: true,
      name: 'Price',
      max: 30,
      min: 0,
      boundaryGap: [0.2, 0.2],
    },
    {
      type: 'value',
      scale: true,
      name: 'Order',
      max: 1200,
      min: 0,
      boundaryGap: [0.2, 0.2],
    },
  ],
  series: [
    {
      name: 'Dynamic Bar',
      type: 'bar',
      xAxisIndex: 1,
      yAxisIndex: 1,
      data: data,
    },
    {
      name: 'Dynamic Line',
      type: 'line',
      data: data2,
    },
  ],
};

export default () => {
  const svgRef = useRef(null);

  useEffect(() => {
    let chart;
    let inter;
    if (svgRef.current) {
      chart = echarts.init(svgRef.current, 'light', {
        renderer: 'svg',
        width: E_WIDTH,
        height: E_HEIGHT,
      });
      chart.setOption(option);

      let count = 11;
      inter = setInterval(function () {
        let axisData = new Date().toLocaleTimeString().replace(/^\D*/, '');

        data.shift();
        data.push(Math.round(Math.random() * 1000));
        data2.shift();
        data2.push(+(Math.random() * 10 + 5).toFixed(1));

        categories.shift();
        categories.push(axisData);
        categories2.shift();
        categories2.push(count++);

        chart.setOption({
          xAxis: [
            {
              data: categories,
            },
            {
              data: categories2,
            },
          ],
          series: [
            {
              data: data,
            },
            {
              data: data2,
            },
          ],
        });
      }, 2100);
    }
    return () => {
      chart?.dispose();
      clearInterval(inter);
    };
  }, []);
  return (
    <View style={styles.container}>
      <SvgChart ref={svgRef} />
    </View>
  );
};

const styles = StyleSheet.create({
  container: {
    flex: 1,
    alignItems: 'center',
    justifyContent: 'center',
  },
});
You should see the following screen:
| iOS | Android |
|---|---|
 |  |
If you want to use the react-native-skia,just replace the SvgChart with SkiaChart and use 'skia' as renderer.
For more chart configuration, please refer to echarts documentation.