Write a simple line chart
Next let's try to draw the most basic diagram - Basic Line Chart.
To see how it looks like in the browser, you can visit the echarts editor and try to modify the configuration to see the changes.
- import echarts, @wuba/react-native-echarts, react. Here I have only import SkiaChart and SkiaRenderer.
import React, { useRef, useEffect } from 'react';
import * as echarts from 'echarts/core';
import { LineChart } from 'echarts/charts';
import { GridComponent } from 'echarts/components';
import { SkiaRenderer, SkiaChart } from '@wuba/react-native-echarts';
- use echarts.use to register the renderer and chart.
echarts.use([SkiaRenderer, LineChart, GridComponent]);
- create a ref for the SkiaChart.
export default function App() {
  const skiaRef = useRef<any>(null);
  return <SkiaChart ref={skiaRef} />;
}
- write the chart option.
const option = {
  xAxis: {
    type: 'category',
    data: ['Mon', 'Tue', 'Wed', 'Thu', 'Fri', 'Sat', 'Sun'],
  },
  yAxis: {
    type: 'value',
  },
  series: [
    {
      data: [150, 230, 224, 218, 135, 147, 260],
      type: 'line',
    },
  ],
};
- create a chart instance and set the option.
let chart = echarts.init(skiaRef.current, 'light', {
  renderer: 'skia',
  width: 400,
  height: 400,
});
chart.setOption(option);
- use useEffect to make sure the chart is initialized only once. And dispose the chart when the component is unmounted.
useEffect(() => {
  return () => chart?.dispose();
}, []);
That's it! Here is the code:
import React, { useRef, useEffect } from 'react';
import * as echarts from 'echarts/core';
import { LineChart } from 'echarts/charts';
import { GridComponent } from 'echarts/components';
import { SkiaRenderer, SkiaChart } from '@wuba/react-native-echarts';

echarts.use([SkiaRenderer, LineChart, GridComponent]);

export default function App() {
  const skiaRef = useRef<any>(null);
  useEffect(() => {
    const option = {
      xAxis: {
        type: 'category',
        data: ['Mon', 'Tue', 'Wed', 'Thu', 'Fri', 'Sat', 'Sun'],
      },
      yAxis: {
        type: 'value',
      },
      series: [
        {
          data: [150, 230, 224, 218, 135, 147, 260],
          type: 'line',
        },
      ],
    };
    let chart: any;
    if (skiaRef.current) {
      chart = echarts.init(skiaRef.current, 'light', {
        renderer: 'skia',
        width: 400,
        height: 400,
      });
      chart.setOption(option);
    }
    return () => chart?.dispose();
  }, []);

  return <SkiaChart ref={skiaRef} />;
}
You should see the following screen:
| iOS | Android |
|---|---|
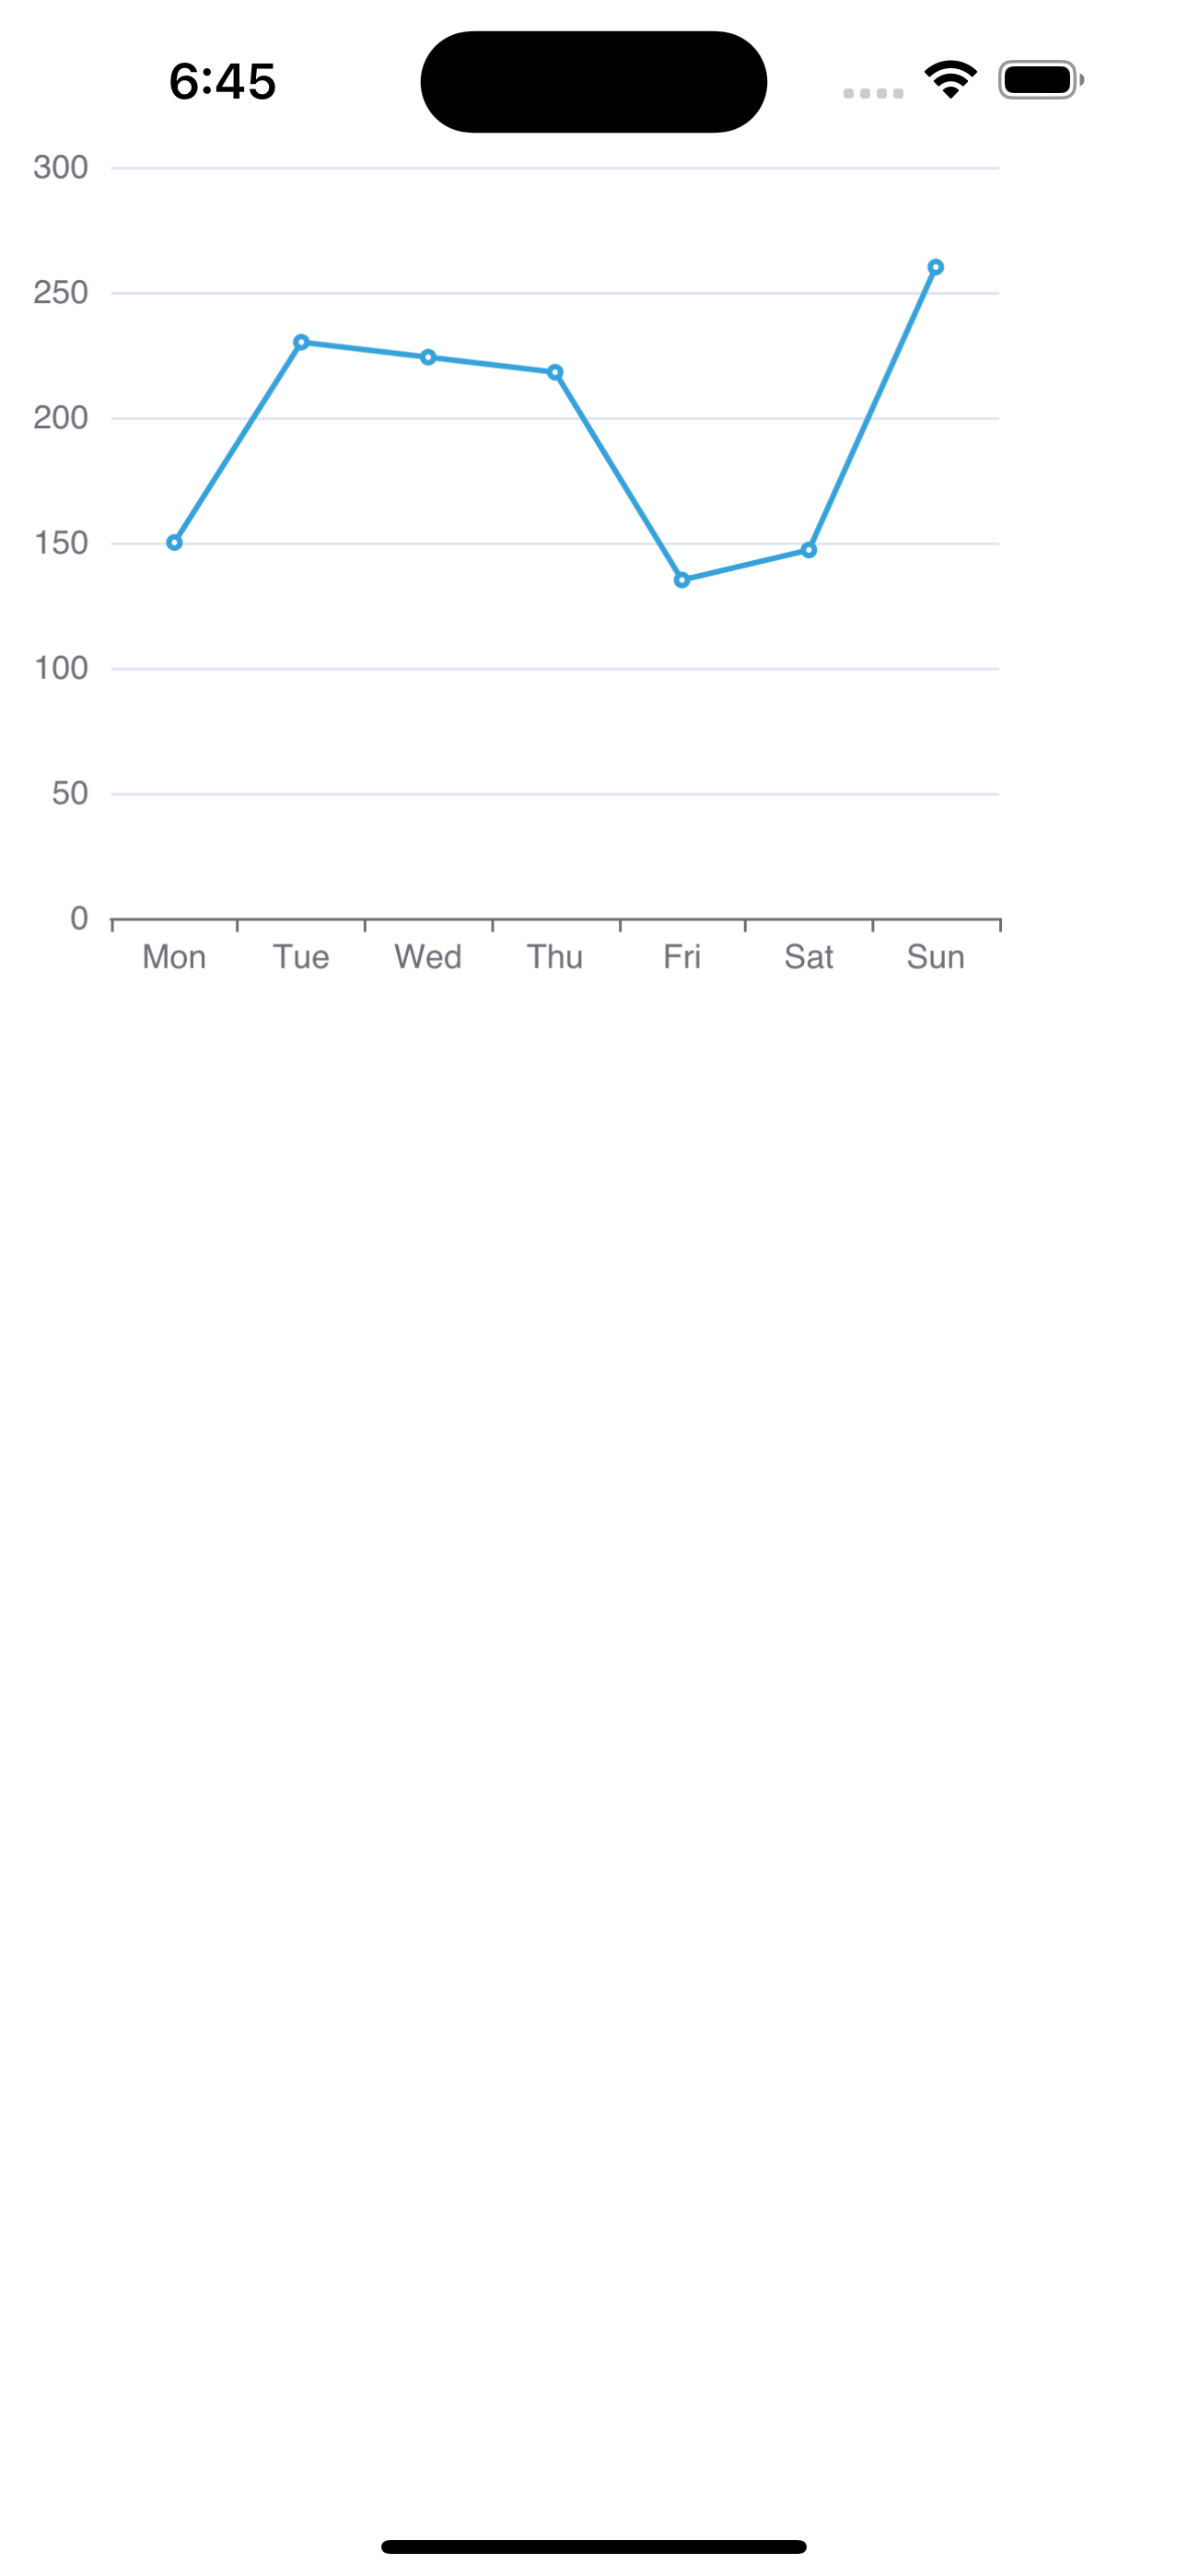 |  |
If you want to use the react-native-svg, just replace the SkiaChart with SvgChart and use 'svg' as renderer.
Next you can find more configurations to use in @wuba/react-native-echarts from the echarts examples.