
Introduction: In modern mobile application development, data visualization is a crucial part. Chart libraries play a key role in React Native applications, helping developers present and analyze data visually. There are many excellent chart libraries available in the React Native ecosystem. In this article, we will compare three popular chart libraries in the React Native community. Let's begin this comparative journey to delve into the differences between React Native ECharts, Victory Native, and React Native Chart Kit.
Chart Library Introduction
React Native Chart Kit
React Native Chart Kit was developed in 2018, it has been 5 years since its inception. With a cumulative download count of 2,840,757, it has garnered 2.5k+ stars on GitHub. It has become a highly popular library in the React Native community.
Victory Native
Victory Native is a chart library that was developed in 2015. It has been 7 years since its inception. With a high cumulative download count of 7,434,044, it has garnered an impressive 10.3k+ stars on GitHub. It is the longest-standing and most widely used chart library in the history of React Native.
React Native ECharts
React Native ECharts is a newly released chart library this year. It currently has 2,565 downloads and has received 363 stars on GitHub. As a rising star among React Native chart libraries, it holds great potential. With time, it is believed that React Native ECharts will become one of the most popular chart libraries.
Here is the comparison table for the basic data:
React Native Chart Kit Victory Native React Native ECharts Creation Date 2018 2015 2023 Downloads 2,840,757 7,434,044 2565 Unpacked Size 399kB 78.4kB 169kB Github star 2.5k+ 10.3k+ 363 Last publish a year ago a month ago a month ago
Comparison of Basic Principles
React Native Chart Kit The main approach is to utilize React Native's native view components to create the basic structure and layout of the charts, such as View, Text, etc. Additionally, libraries like react-native-svg and paths-js are used for rendering the charts with vector graphics.
Victory Native also relies on React Native's native views combined with SVG for rendering. It also draws inspiration from D3 (Data-Driven Documents) by mapping data to chart elements and using scales to transform data values and positions.
React Native ECharts fetches the SVG graphic data of ECharts charts and rewrites the SVGPainter of ECharts. By utilizing the existing chart data of ECharts, it renders the charts on the React Native side using either react-native-svg or react-native-skia.
Code Writing Comparison
Let's take the commonly used area chart as an example. Now, let's see how they are implemented using the following code snippets:
- React Native Chart Kit
import { LineChart } from"react-native-chart-kit";
import { StyleSheet, View, Text } from 'react-native';
const chartConfig = {
    backgroundGradientFrom: "#fff",
    backgroundGradientFromOpacity: 0,
    backgroundGradientTo: "#fff",
    backgroundGradientToOpacity: 0.5,
    color: (opacity = 1) => `rgba(14, 17, 22, ${opacity})`,
    strokeWidth: 2, // optional, default 3
    barPercentage: 0.5,
    useShadowColorFromDataset: false // optional
};
export const LineChart1 = props => {
    const data = {
        labels: ['Mon', 'Tue', 'Wed', 'Thu', 'Fri', 'Sat', 'Sun'],
        // labels: props.date,
        datasets: [
          {
            data: [150, 230, 224, 218, 135, 147, 260],
            // color: (opacity = 1) => `rgba(134, 65, 244, ${opacity})`, // optional
            strokeWidth: 2 // optional
          }
        ],
      };
    return (
        <View style={styles.container}>
            <Text>React Native Chart Kit</Text>
            <LineChart
                data={data}
                width={400}
                height={200}
                yAxisInterval={1}
                animate
                chartConfig={chartConfig}
                withDots={false}
            />
      </View>
    )

}
- Victory Native
import { StyleSheet, View, Text } from "react-native";
import {
  VictoryArea,
  VictoryChart,
  VictoryLine,
  VictoryTheme,
  VictoryScatter,
} from "victory-native";

export const LineChart2 = props => {
  const data = [
      { x: 'Mon', y: 150 },
      { x: 'Tue', y: 230 },
      { x: 'Wed', y: 224 },
      { x: 'Thu', y: 218 },
      { x: 'Fri', y: 135 },
      { x: 'Sat', y: 147 },
      { x: 'sun', y: 260 },
    ];
  return (
    <View style={styles.container}>
      <Text style={styles.title}>Victory Native</Text>
      <VictoryChart
        theme={VictoryTheme.material}
        height={250}
        width={400}
      >
        <VictoryArea
          style={{ data: { fill: "rgba(230, 231, 231,0.8)" } }}
          data={data}
          animate={{
            duration: 2000,
            onLoad: { duration: 1000 },
          }}
        />
        <VictoryLine
          data={data}
          style={{ data: { stroke: "#d6d6d7", strokeWidth: 2 } }}
        />
        <VictoryScatter
          data={data}
          size={4}
          style={{ data: { fill: "#24262a" } }}
        />
      </VictoryChart>
    </View>
  );
};
- React Native ECharts
import { StyleSheet, Text, View } from 'react-native';
import { useRef, useEffect } from 'react';
import * as echarts from 'echarts/core';
import { LineChart } from 'echarts/charts';
import { GridComponent } from 'echarts/components';
import { SVGRenderer, SkiaChart } from '@wuba/react-native-echarts';
echarts.use([SVGRenderer, LineChart, GridComponent]);
export const LineCharts = props => {
  const skiaRef = useRef(null);
  useEffect(() => {
    const option = {
      xAxis: {
        type: 'category',
        data:  ['Mon', 'Tue', 'Wed', 'Thu', 'Fri', 'Sat', 'Sun'],
        splitLine: {
          show: true,
          lineStyle: {
            type: 'dashed',
          },}
      },
      yAxis: {
        type: 'value',
        min: 'dataMin',
        splitLine: {
          show: true,
          lineStyle: {
            type: 'dashed',
          },}
      },
      series: [
        {
          data: [150, 230, 224, 218, 135, 147, 260],
          type: 'line',
          areaStyle: {
            color: 'rgba(230, 231, 231,0.8)'
          },
          lineStyle: {
            color: '#d6d6d7'
          },
          symbol: 'circle',
          symbolSize: 8,
          itemStyle: {
            color: '#24262a',
          },
        },
      ],
    };
    let chart;
    if (skiaRef.current) {
      chart = echarts.init(skiaRef.current, 'light', {
        renderer: 'svg',
        width: 400,
        height: 300,
      });
      chart.setOption(option);
    }
    return () => chart?.dispose();
  }, []);
  return (
    <View style={styles.container}>
        <Text style={styles.title}>React Native ECharts</Text>
        <SkiaChart ref={skiaRef} />
    </View>
  );
}
The effect is displayed as follows:

From a code-writing perspective, Victory Native is data-driven, so you typically pass in data and configure related styles through props. Most importantly, it acts more like a set of tools that you can DIY. You can use various components exposed by Victory to customize the charts according to your needs. For example, if you want to add a line and data points to the area chart, you would need to additionally include VictoryLine and VictoryScatter components.
React Native Echarts and React Native Chart Kit are similar in usage. Both libraries centralize data and styles within the configuration options. They are more like fully featured tools that allow you to transform the charts by modifying the configurations. Comparatively, the configuration code for React Native Chart Kit is simpler, but it may lack some advanced customization options. For example, enabling animation or setting a specific starting value for the y-axis might not be achievable.
In terms of writing code, I prefer the configuration-based approach. It is straightforward, easy to grasp, and can improve development efficiency for developers.
Development Experience
Comparison of Rendering Performance
When it comes to regular charts such as area, bar, and pie charts, all three libraries perform well with small datasets, providing smooth rendering. However, as the data size reaches the order of thousands, noticeable performance differences become apparent. Victory Native and React Native Chart Kit experience significant lags and, in the case of larger datasets, Victory may even crash. On the other hand, React Native ECharts benefits from ECharts' default data sampling mechanism, which reduces the number of data points when rendering large amounts of data. This helps avoid overcrowding the chart and performance degradation. ECharts automatically sample a relatively small number of data points based on the width of the plotting area and the number of data points, reducing computational and rendering time. Leveraging this mechanism, React Native ECharts demonstrates significantly better rendering performance when dealing with large datasets.
Here is an example of rendering an area chart using randomly generated 200 data points:


As we can see, React Native ECharts still maintain relatively good rendering performance. On the other hand, adjustments to data and coordinates are required when using the other two libraries to meet specific business requirements.
When we increase the test data to 2000 points, React Native Chart Kit exhibits noticeable rendering lag, while Victory Native throws an error stating Maximum call stack size is exceeded. Meanwhile, React Native ECharts, benefiting from data sampling, still deliver satisfactory rendering results:

Comparison of Chart Variety
React Native Chart Kit Currently, React Native Chart Kit supports a relatively limited number of chart types. It mainly covers six specific types of charts, which can fulfill most basic business requirements. However, if there is a need for other types of charts, additional libraries may need to be introduced.
The following image shows most of the chart types that React Native Chart Kit can cover, and it can be seen that the variety is relatively limited. 😭 Currently, the developers are continuously maintaining the library and may add more chart types in the future.

Victory Native When it comes to chart variety, Victory Native offers a greater range compared to React Native Chart Kit. However, due to the nature of Victory's approach, which involves assembling components to create different types of charts, developers need to have a good understanding of component composition and possess solid coding skills. Additionally, the examples provided on the official Victory website may not be beginner-friendly, as the supported chart instances may not be immediately intuitive. Overall, using Victory Native requires a higher level of coding proficiency and logical thinking.
The following image showcases the main components provided by Victory on their official website. It can be observed that there are significantly more options available compared to React Native Chart Kit. Moreover, Victory Native primarily relies on combining these components, such as points, lines, areas, and axes, to create various types of charts. This allows for a broader range of supported chart types.
(Image source: https://formidable.com/open-source/victory/docs/)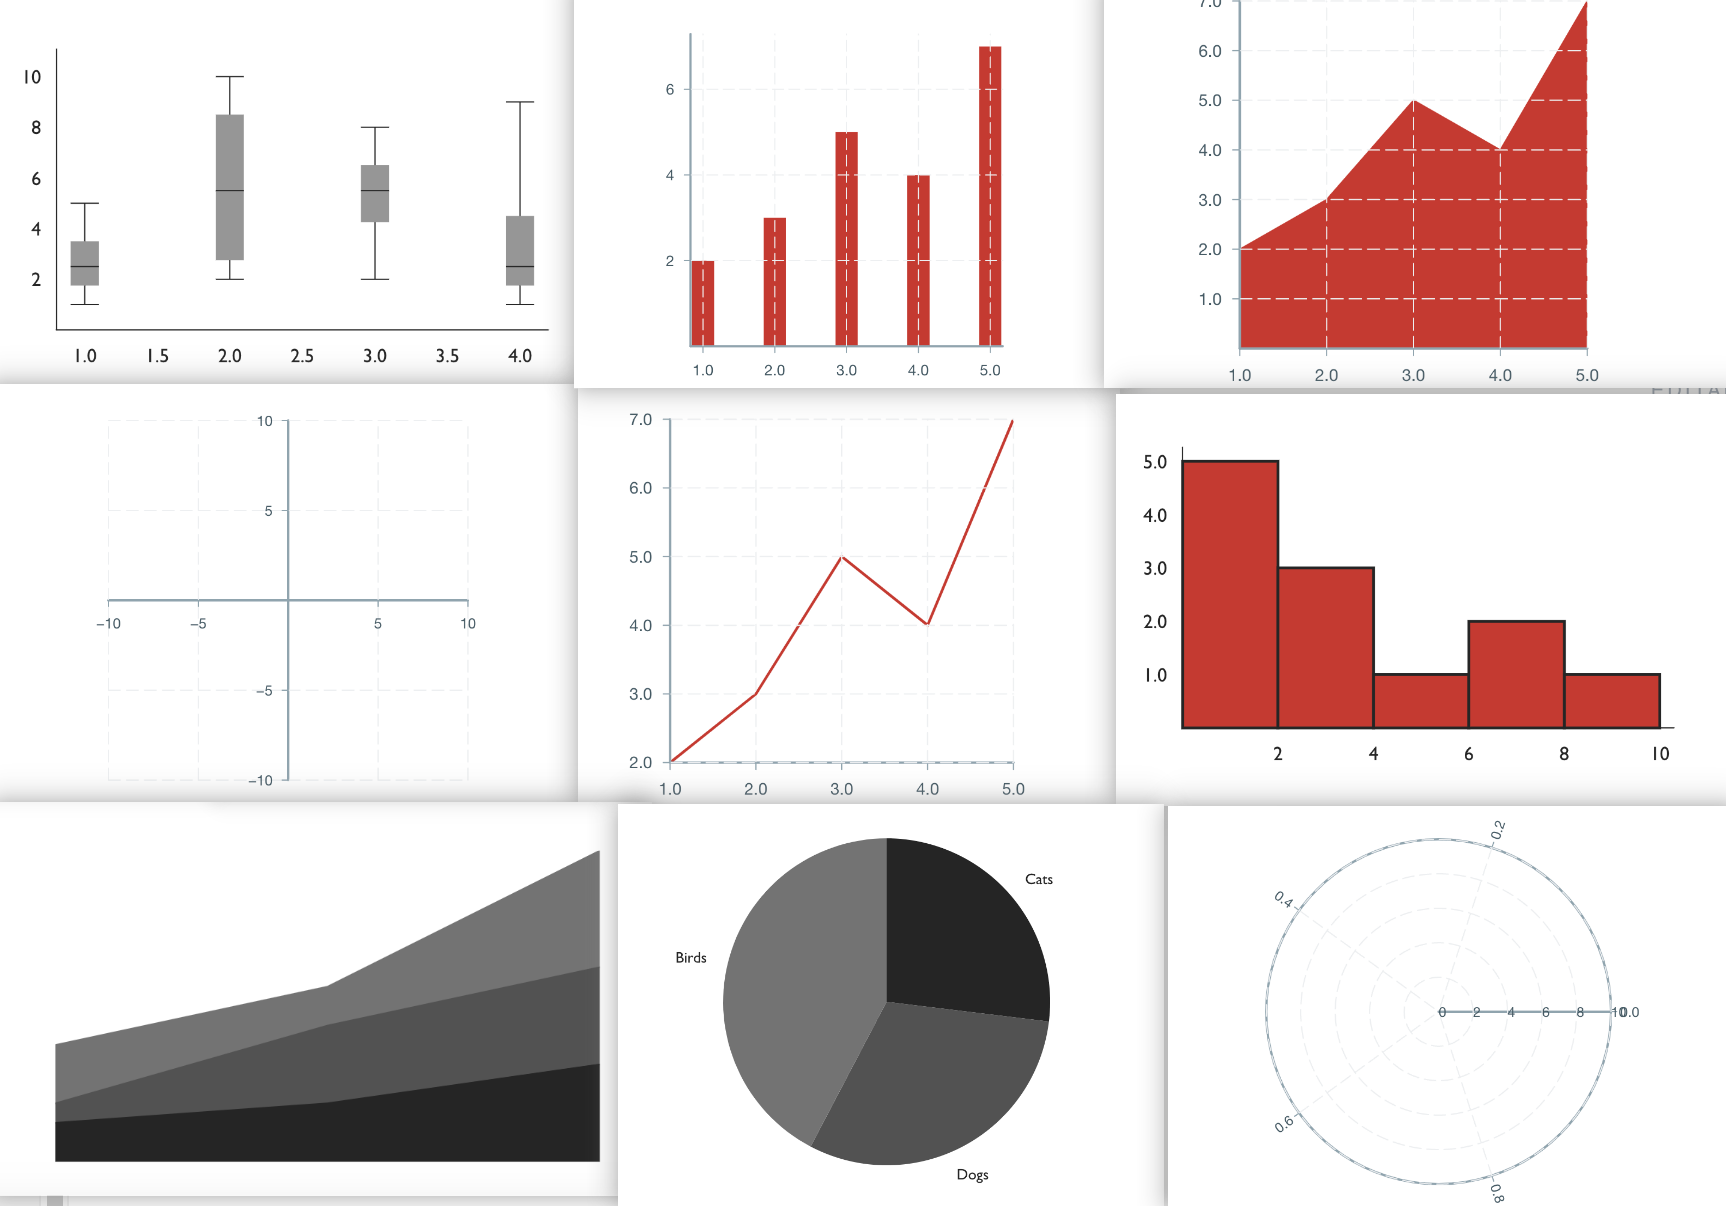
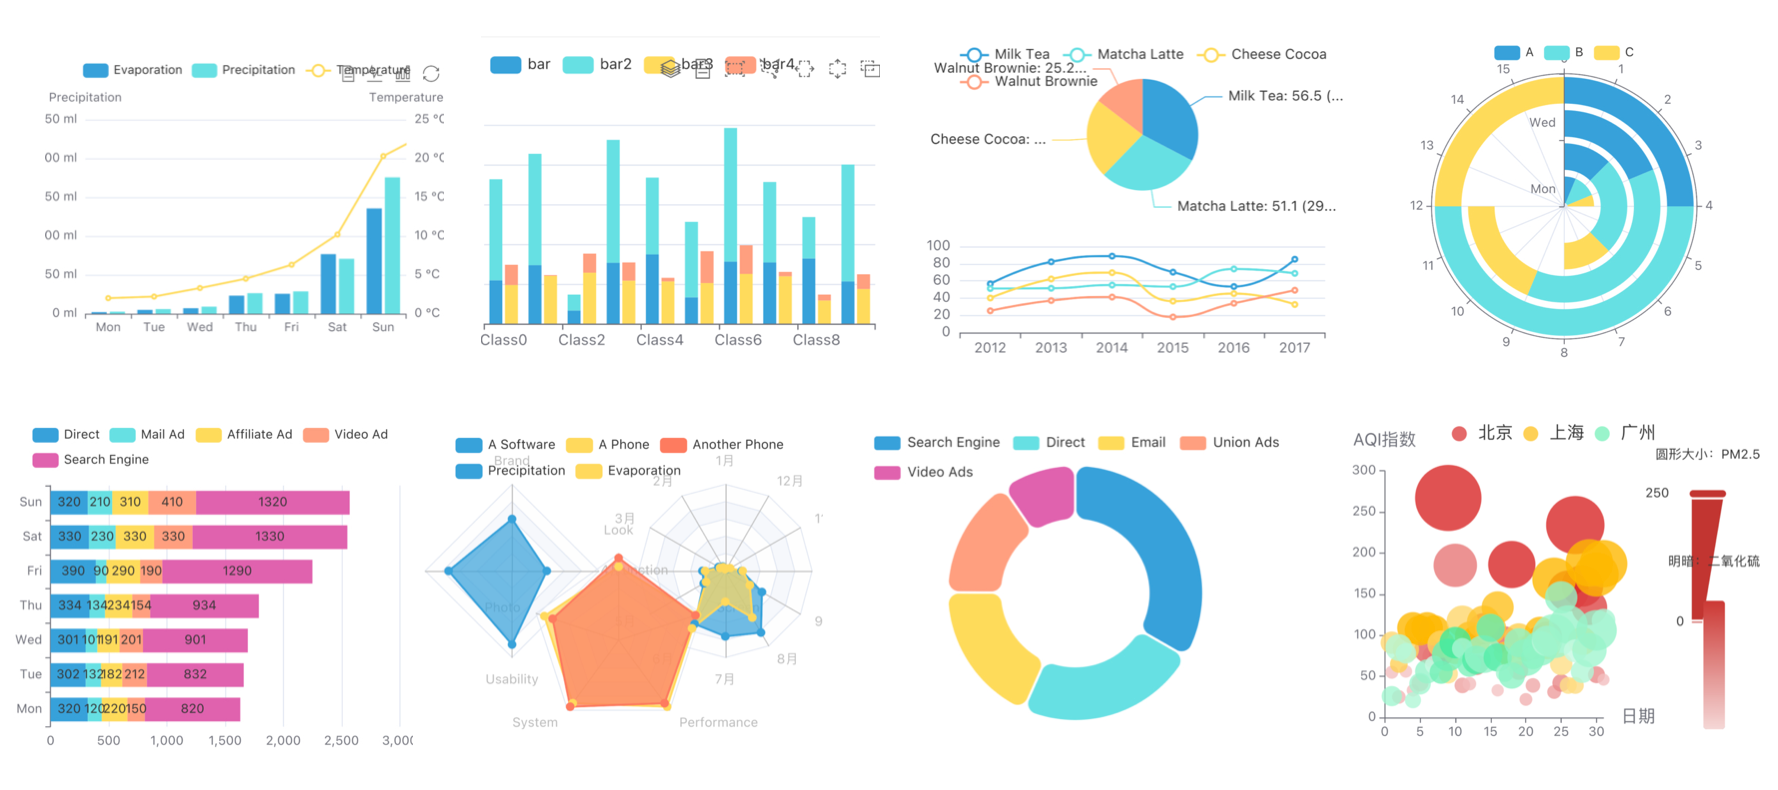
React Native ECharts You can directly refer to the examples on the ECharts official website, where various types of charts are showcased in a highly intuitive manner. Developers can use the configuration options to customize the charts according to their needs. Currently, React Native ECharts supports rendering most of the chart types that ECharts offers.
React Native ECharts utilizes the SVG data from ECharts, which means users can render a wide range of different chart types by simply following the examples provided on the ECharts website and configuring their settings😍
(Image source: https://echarts.apache.org/examples/zh/index.html)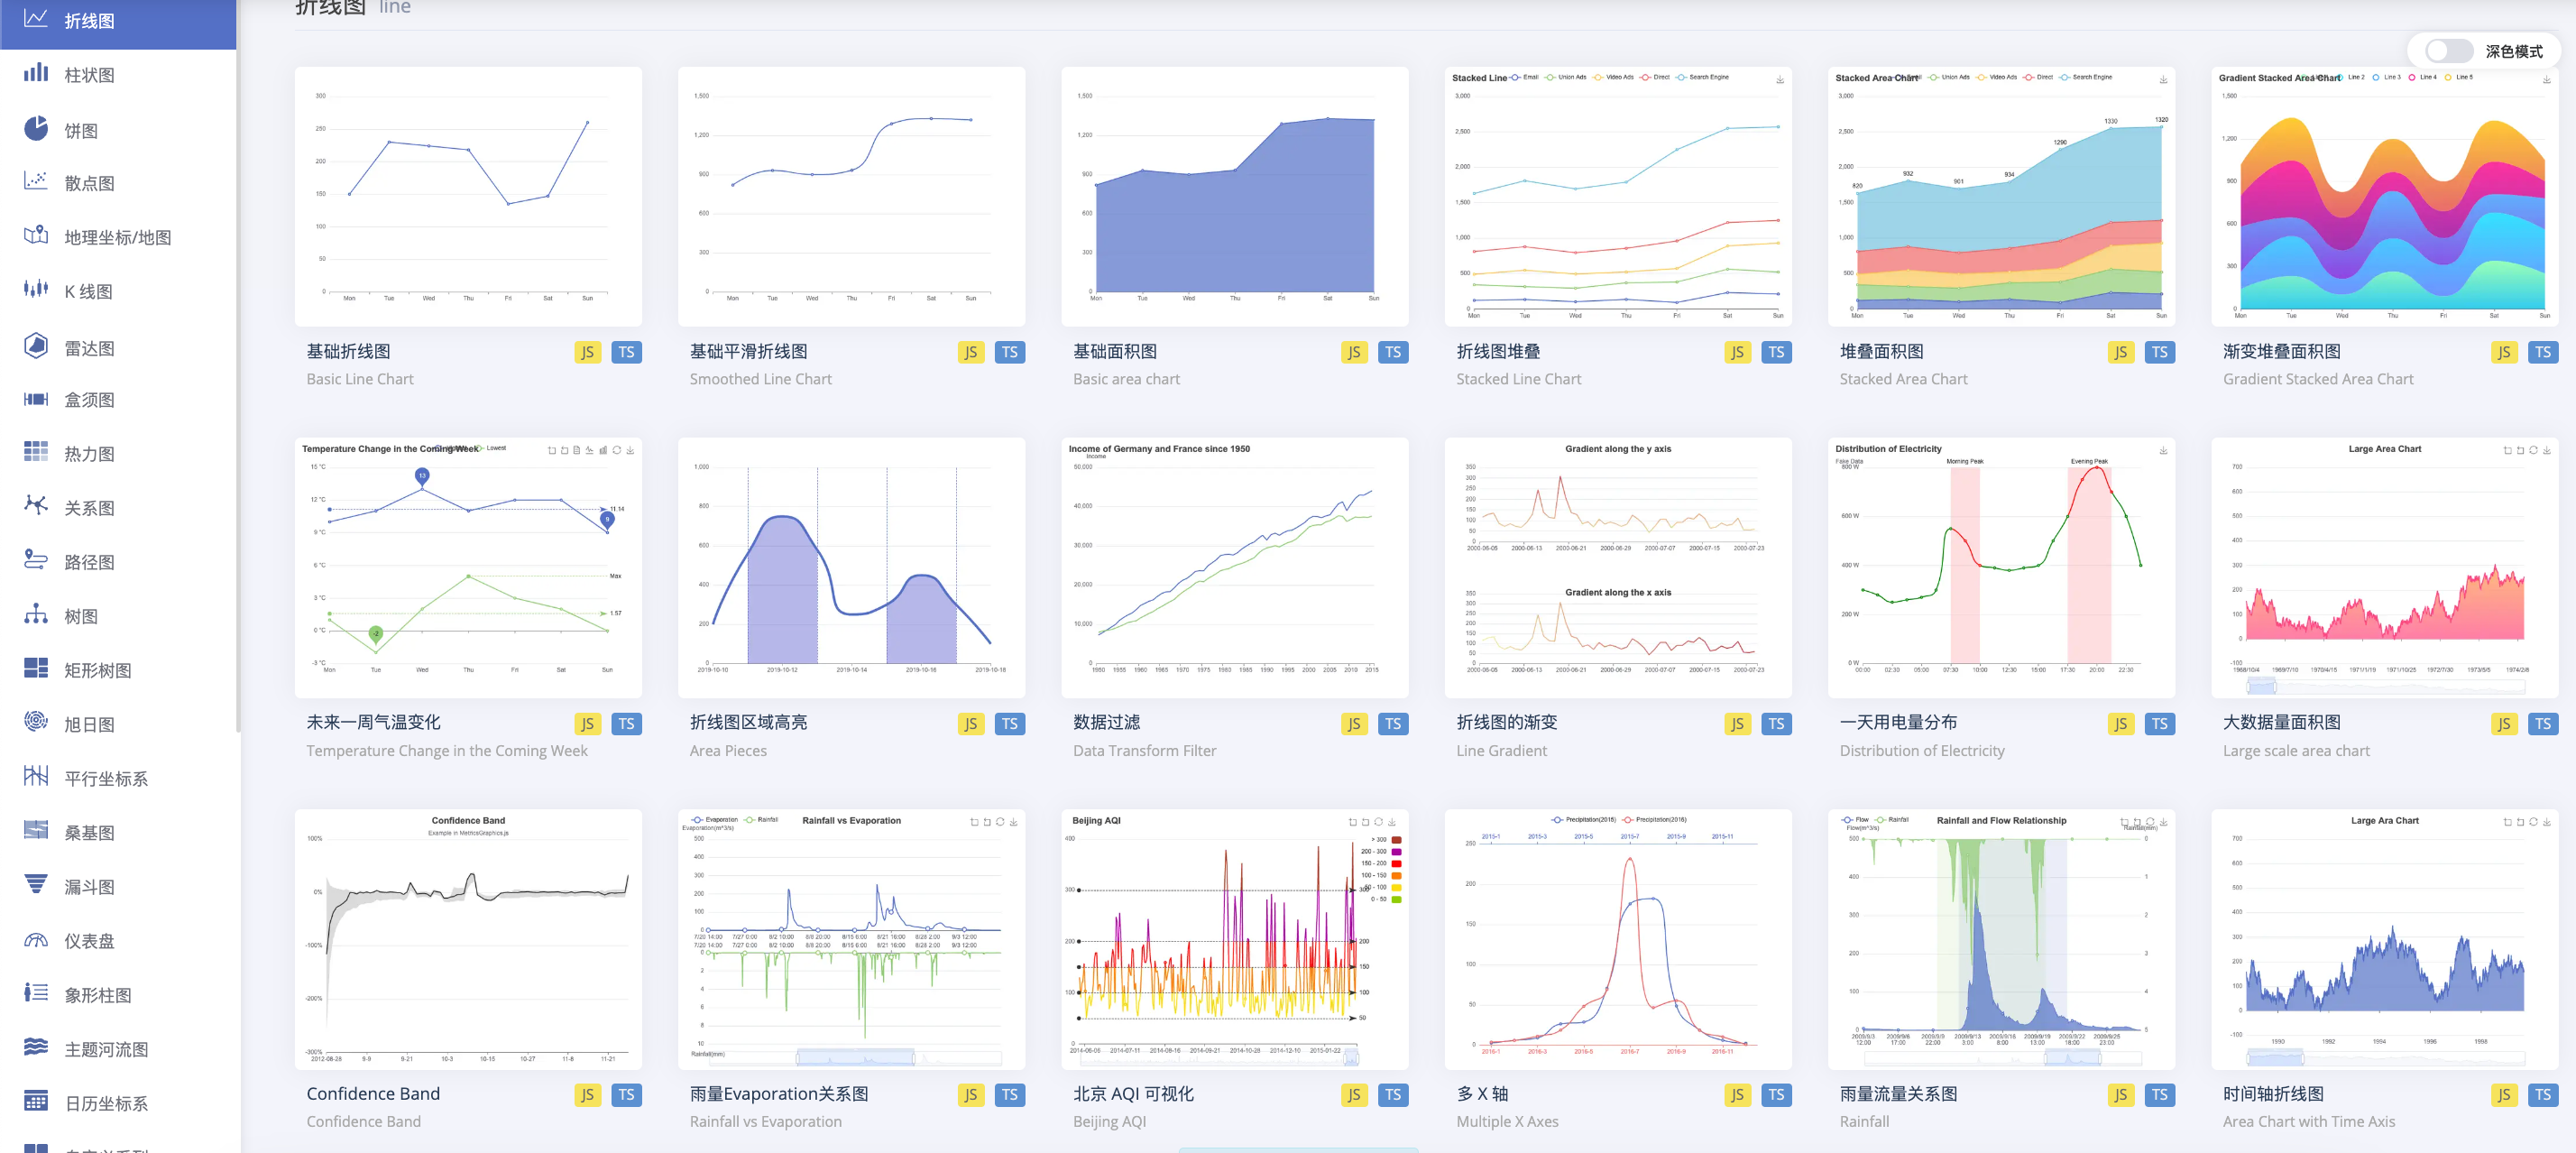
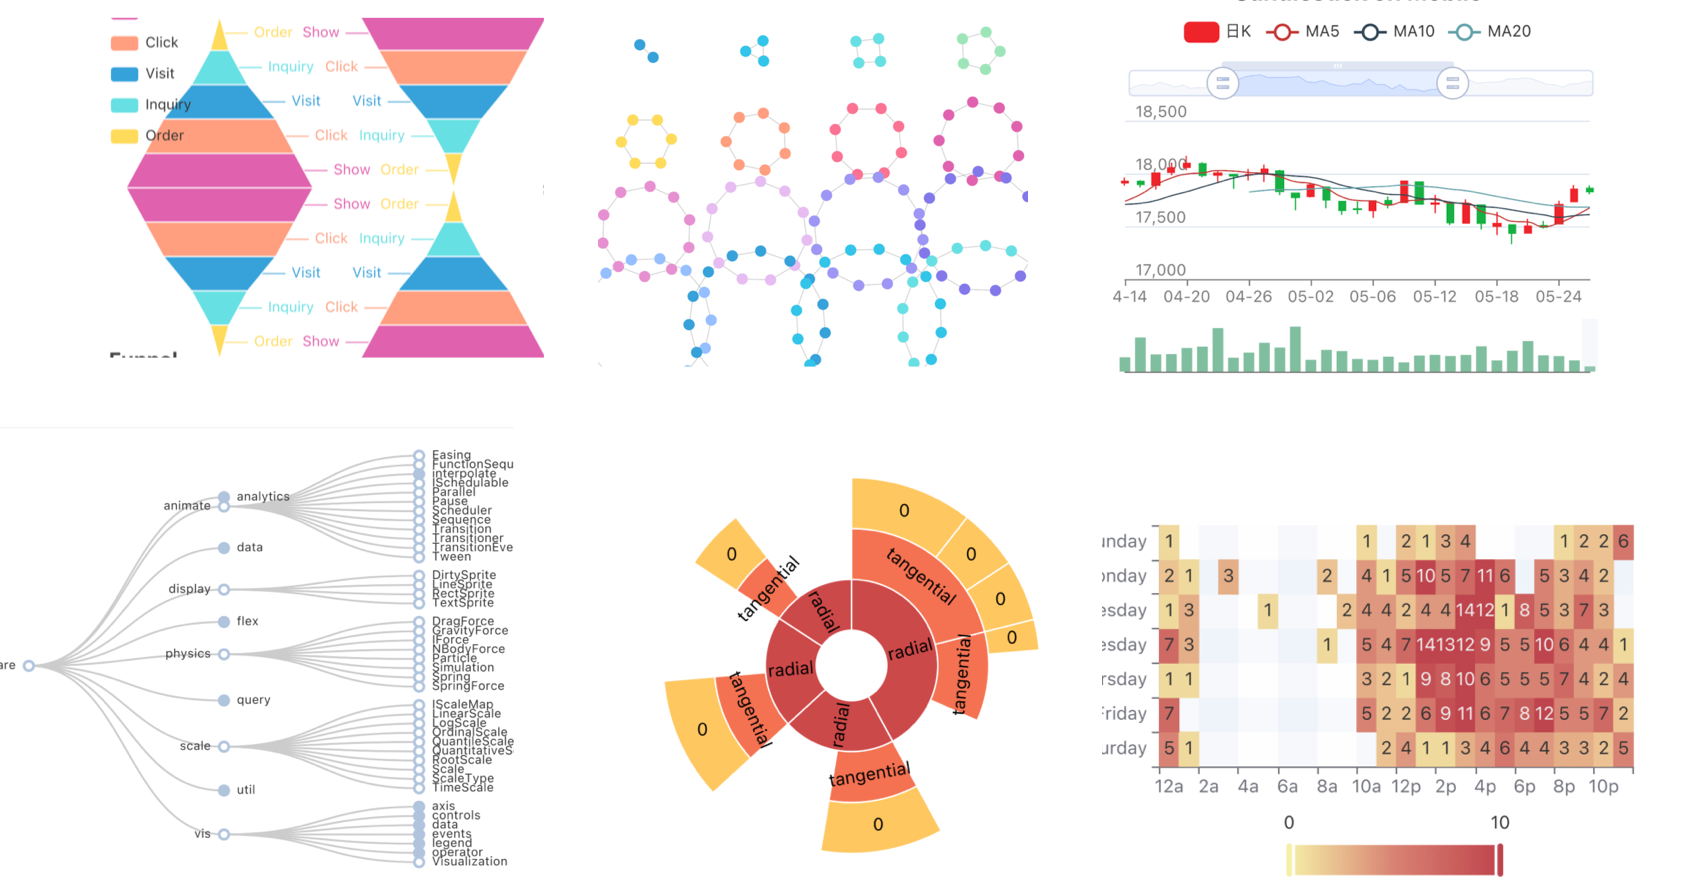
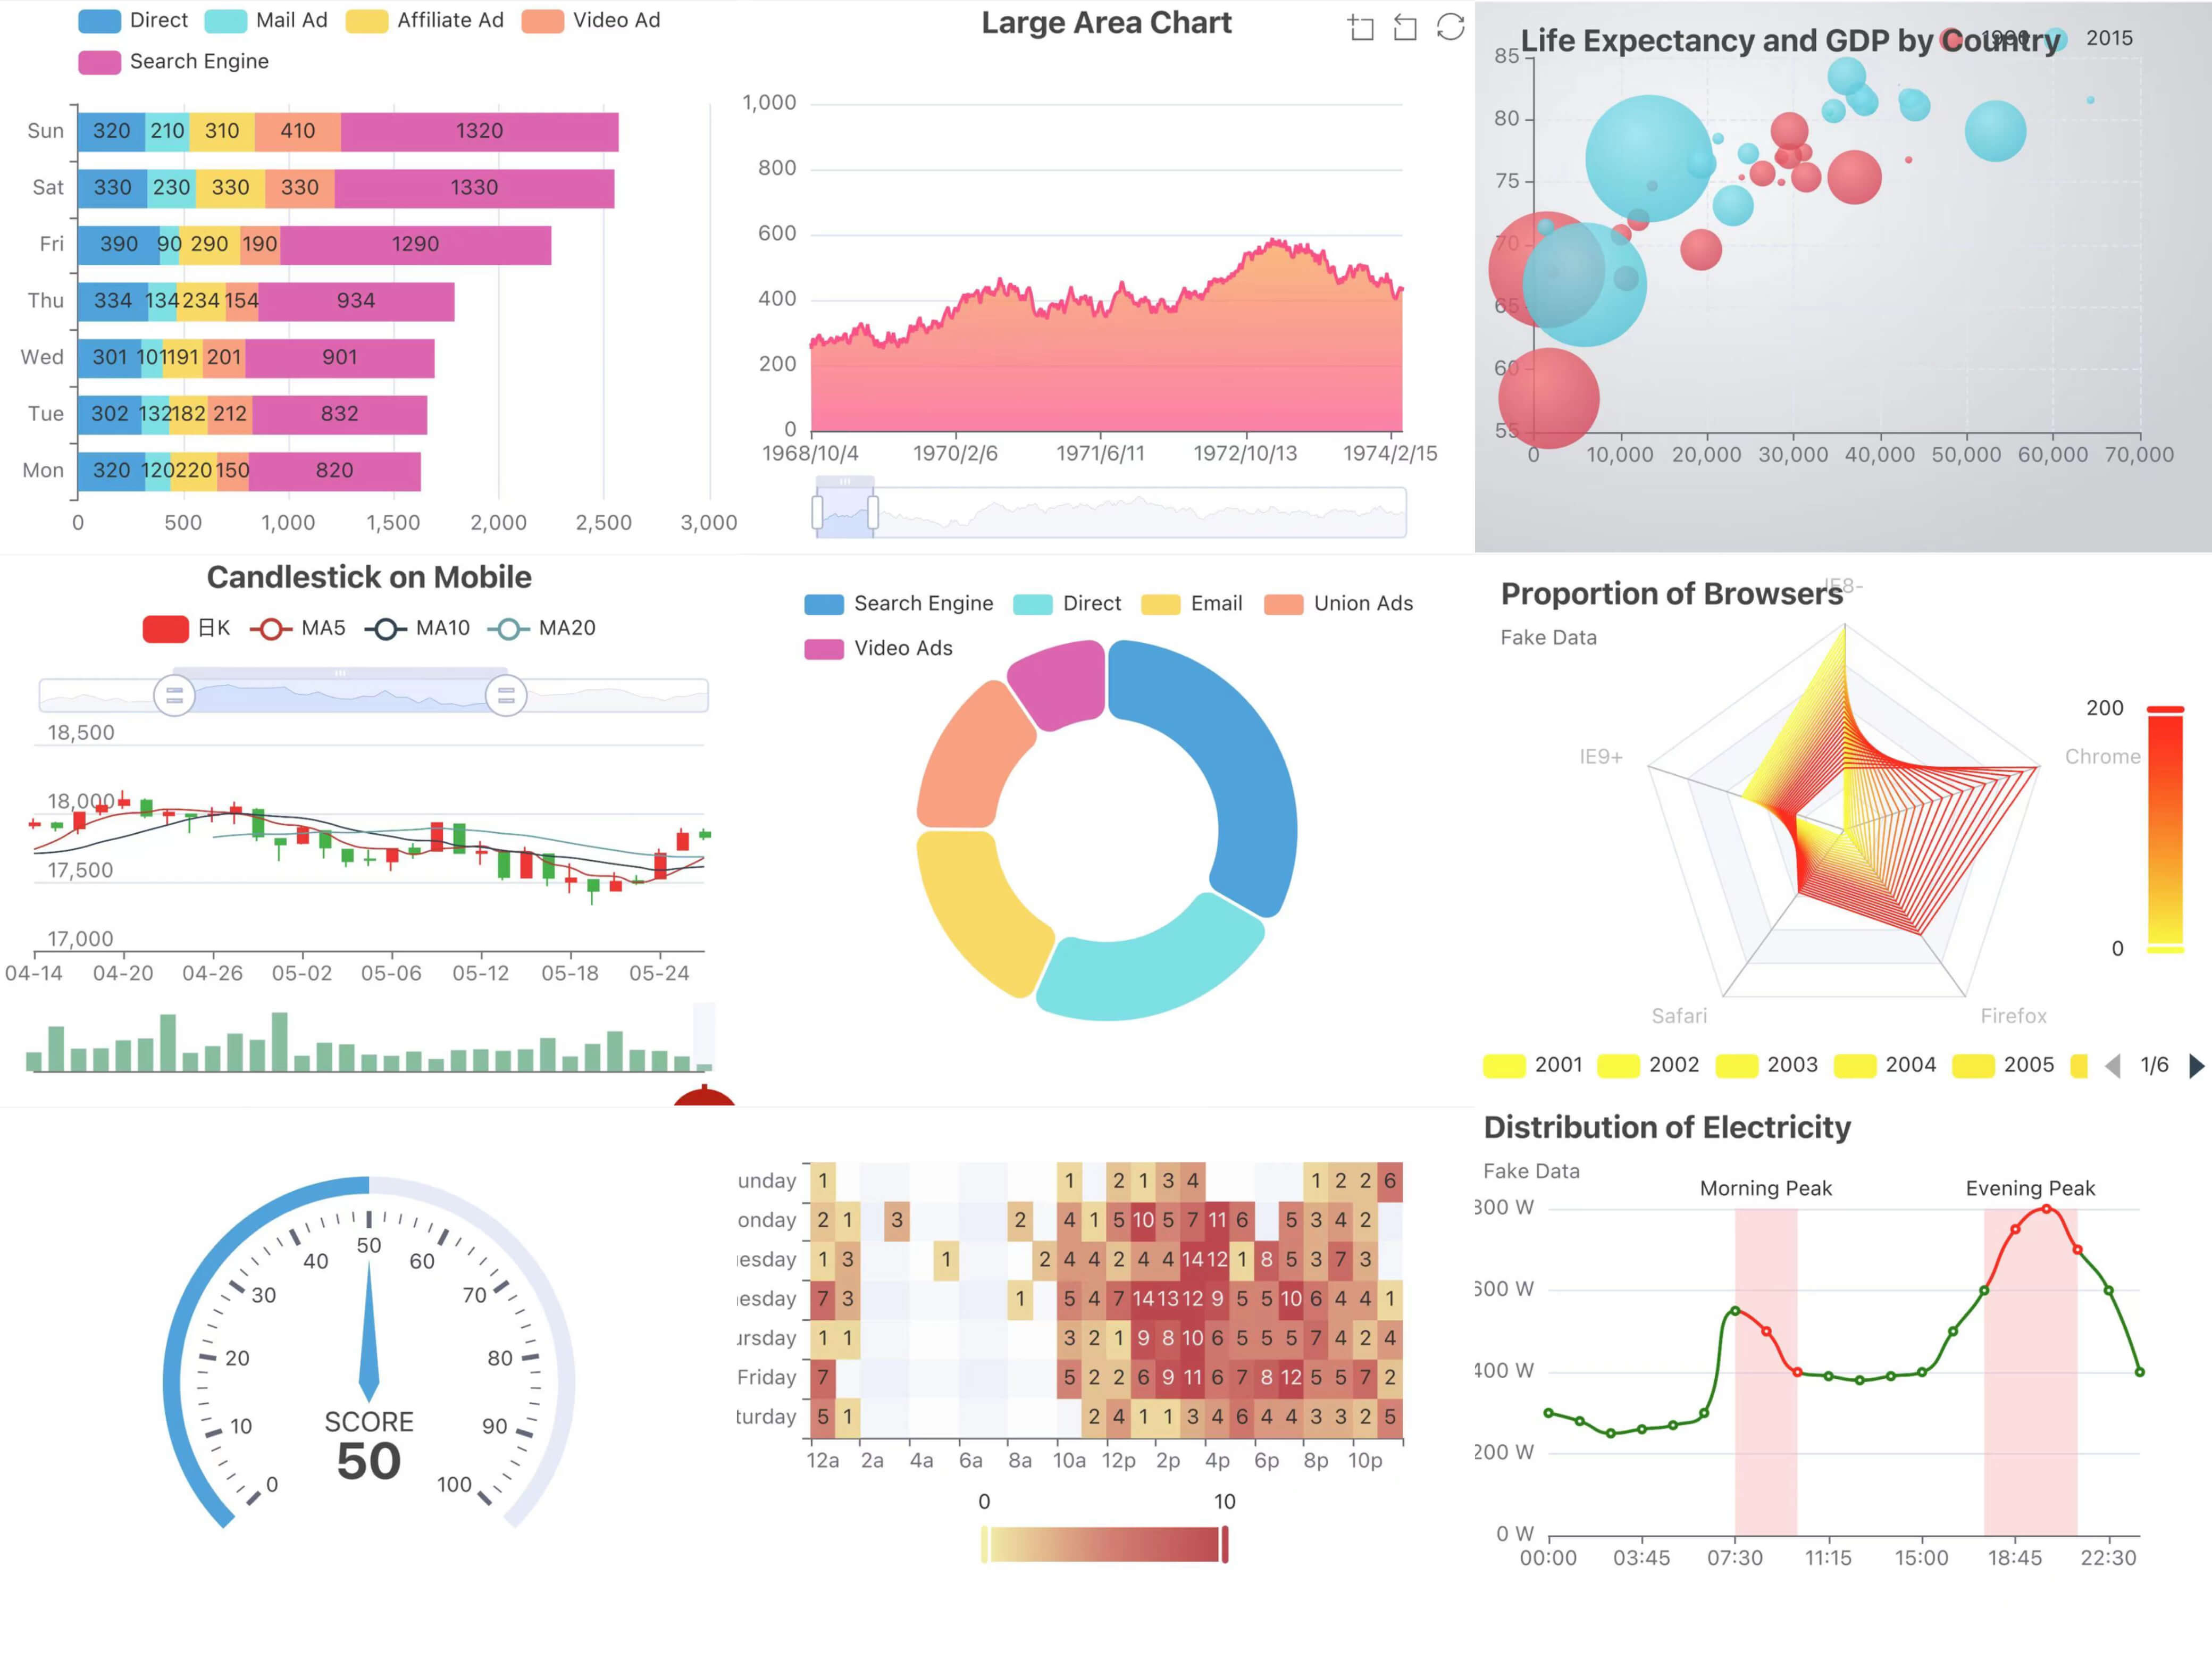
The following image showcases some chart types that cannot be easily implemented or require complex combinations using other libraries. However, with React Native ECharts, you can effortlessly achieve these charts by referring to the documentation🚀

Comparison of Guide
Getting started with React Native Chart Kit primarily involves using the documentation and configuration options provided by the library's authors, which can be found on GitHub or npm. By referring to these resources, developers can easily implement chart rendering in their projects.
On the other hand, Victory Native has its website, where developers can assemble charts by referring to the provided components and related code in the documentation. However, the website offers a large number of components and elements, making it difficult for developers to quickly find the desired examples. Implementing complex charts often requires developers to think of their implementation methods, which can lower development efficiency.
Compared to Victory Native and React Native Chart Kit, React Native ECharts has several advantages:
Documents
The description provided in the official documentation of Victory Native is more clear, comprehensive, and provides ready-to-use examples. Developers can easily understand the library's features, configurations, and usage through the documentation. Additionally, there are numerous usage examples available on the official ECharts website, which further assists developers in quickly implementing various types of charts.
Online Preview
Just like the ECharts library, React Native ECharts provides an online preview and testing support. You can directly copy the chart configuration to see how it renders in React Native. Click here for an online preview
Multiterminal code
React Native ECharts also support component reuse on the web, enabling cross-platform requirements and achieving code sharing across multiple platforms. It effortlessly achieves code uniformity and ensures consistency of charts across different platforms, thus enhancing our development efficiency.
Support for two rendering modes
React Native ECharts supports two rendering modes: Svg and Skia. It is implemented based on react-native-svg and react-native-skia. react-native-skia utilizes the Skia Graphics Library, which is a high-performance graphics rendering engine that provides faster drawing and rendering speeds. It is a boon for developers who want to experience Skia's capabilities.
Conclusion
Finally, let's compare the performance of these three chart libraries from the following perspectives:
| React Native Chart Kit | Victory Native | React Native ECharts | |
|---|---|---|---|
| Basic Chart Suitability | ✅ | ✅ | ✅ |
| Chart Variety | ➖ | ✅ | ✅ |
| Rendering for Large Data | ➖ | ➖ | ✅ |
| Ease of Development | ✅ | ➖ | ✅ |
| Multiterminal code | ➖ | ➖ | ✅ |
It is undeniable that both Victory Native and React Native Chart Kit are excellent chart libraries for React Native. However, the newly introduced React Native ECharts has certain advantages in terms of applicability and ease of entry. Especially in some relatively complex but common charts, such as path charts, radar charts, and candlestick charts, React Native ECharts provides examples that allow developers to easily implement them by simply modifying the data in the example code. In these scenarios, React Native ECharts is highly recommended as it greatly improves development efficiency. Additionally, for projects with a high demand for various types of charts, the rich collection of chart examples provided by React Native ECharts makes it easier for us to handle diverse chart requirements😁