建立一個自適應大小的圖表
在編碼過程中,有時我們不想直接定義固定大小的圖表,而是讓 ECharts 圖表自動適應容器大小。 在這裡,我們將提供一個簡單的示例來演示如何完成這個。
- 首先,與前面的示例一樣,匯入圖表依賴項。 在這裡,我們使用 LineChart,所以我們只匯入它。 在實踐中,您應該根據您的特定用例匯入圖表。
import React, { useState, useRef, useEffect } from "react";
import { StyleSheet, View, Dimensions } from "react-native";
import * as echarts from "echarts/core";
import { LineChart } from "echarts/charts";
import { GridComponent } from "echarts/components";
import { SkiaRenderer, SkiaChart } from "@wuba/react-native-echarts";
- 使用 echarts.use 註冊渲染器和圖表。
echarts.use([SkiaRenderer, LineChart, GridComponent]);
- 為 SkiaChart 元件建立一個參考,並使用 View 容器將其包裝起來。 使用 onLayout 獲取容器的寬度和高度,以便以後分配給 ECharts 圖表。
export default function App() {
  const skiaRef = useRef<any>(null);
  const chartRef = useRef<any>(null);
  const [chartWidth, setChartWidth] = useState<number>(0);
  const [chartHeight, setChartHeight] = useState<number>(0);
}
- 寫下圖表選項。
const option = {
  xAxis: {
    type: "category",
    data: ["Mon", "Tue", "Wed", "Thu", "Fri", "Sat", "Sun"],
    splitLine: {
      show: true,
      lineStyle: {
        type: "dashed",
      },
    },
  },
  yAxis: {
    type: "value",
    min: "dataMin",
    splitLine: {
      show: true,
      lineStyle: {
        type: "dashed",
      },
    },
  },
  series: [
    {
      data: [150, 230, 224, 218, 135, 147, 260],
      type: "line",
      areaStyle: {
        color: "rgba(230, 231, 231,0.8)",
      },
      lineStyle: {
        color: "#d6d6d7",
      },
      symbol: "circle",
      symbolSize: 8,
      itemStyle: {
        color: "#24262a",
      },
    },
  ],
};
- 建立一個圖表例項並設定選項。
let chart = echarts.init(skiaRef.current, "light", {
  renderer: "skia",
  width: chartWidth,
  height: chartHeight,
});
chart.setOption(option);
遵循上述步驟後,我們有一個與父容器大小匹配的初始圖表。 如果我們還需要圖表根據外部條件調整其大小,還有一些步驟需要採取。 在這裡,我們將演示如何使圖表響應移動螢幕尺寸的變化。
- 註冊“尺寸”更改事件以監聽螢幕尺寸的變化。
const handleDimensionsChange = (e) => {
  const { width, height } = e.screen;
};

useEffect(() => {
  Dimensions.addEventListener("change", handleDimensionsChange);
  return () => {
    Dimensions.removeEventListener("change", handleDimensionsChange);
  };
}, []);
- 檢測到螢幕尺寸變化後,重置圖表的尺寸。
const handleDimensionsChange = (e) => {
  const { width, height } = e.screen;
  setChartWidth(width);
  setChartHeight(height);
};
- 重新繪製圖表。
useEffect(() => {
  chartRef.current.resize({
    width: chartWidth,
    height: chartHeight,
  });
}, [chartWidth, chartHeight]);
完整程式如下:
import React, { useState, useRef, useEffect } from "react";
import { StyleSheet, View, Dimensions } from "react-native";
import * as echarts from "echarts/core";
import { LineChart } from "echarts/charts";
import { GridComponent } from "echarts/components";
import { SkiaRenderer, SkiaChart } from "@wuba/react-native-echarts";

echarts.use([SkiaRenderer, LineChart, GridComponent]);

export default function App() {
  const skiaRef = useRef<any>(null);
  const chartRef = useRef<any>(null);
  const [chartWidth, setChartWidth] = useState<number>(0);
  const [chartHeight, setChartHeight] = useState<number>(0);

  useEffect(() => {
    Dimensions.addEventListener("change", handleDimensionsChange);
    return () => {
      Dimensions.removeEventListener("change", handleDimensionsChange);
    };
  }, []);

  useEffect(() => {
    const option = {
      xAxis: {
        type: "category",
        data: ["Mon", "Tue", "Wed", "Thu", "Fri", "Sat", "Sun"],
        splitLine: {
          show: true,
          lineStyle: {
            type: "dashed",
          },
        },
      },
      yAxis: {
        type: "value",
        min: "dataMin",
        splitLine: {
          show: true,
          lineStyle: {
            type: "dashed",
          },
        },
      },
      series: [
        {
          data: [150, 230, 224, 218, 135, 147, 260],
          type: "line",
          areaStyle: {
            color: "rgba(230, 231, 231,0.8)",
          },
          lineStyle: {
            color: "#d6d6d7",
          },
          symbol: "circle",
          symbolSize: 8,
          itemStyle: {
            color: "#24262a",
          },
        },
      ],
    };
    let chart: any;
    if (skiaRef.current) {
      chart = echarts.init(skiaRef.current, "light", {
        renderer: "skia",
        width: chartWidth,
        height: chartHeight,
      });
      chart.setOption(option);
      chartRef.current = chart;
    }
    return () => chart?.dispose();
  }, []);


  // watching for size changes, redraw the chart.
  useEffect(() => {
    chartRef.current.resize({
      width: chartWidth,
      height: chartHeight,
    });
  }, [chartWidth, chartHeight]);

  // Get the width and height of the container
  const handleLayout = (e) => {
    const { width, height } = e.nativeEvent.layout;
    setChartWidth(width);
    setChartHeight(height);
  };

  // Screen orientation change event
  const handleDimensionsChange = (e) => {
    const { width, height } = e.screen;
    setChartWidth(width);
    setChartHeight(height);
  };

  // The parent container box must have width and height in order to inherit
  return (
    <View style={styles.container} onLayout={handleLayout}>
      <SkiaChart ref={skiaRef} />
    </View>
  );
}

const styles = StyleSheet.create({
    container: {
        flex: 1,
        alignItems: 'center',
        justifyContent: 'center',
    },
}
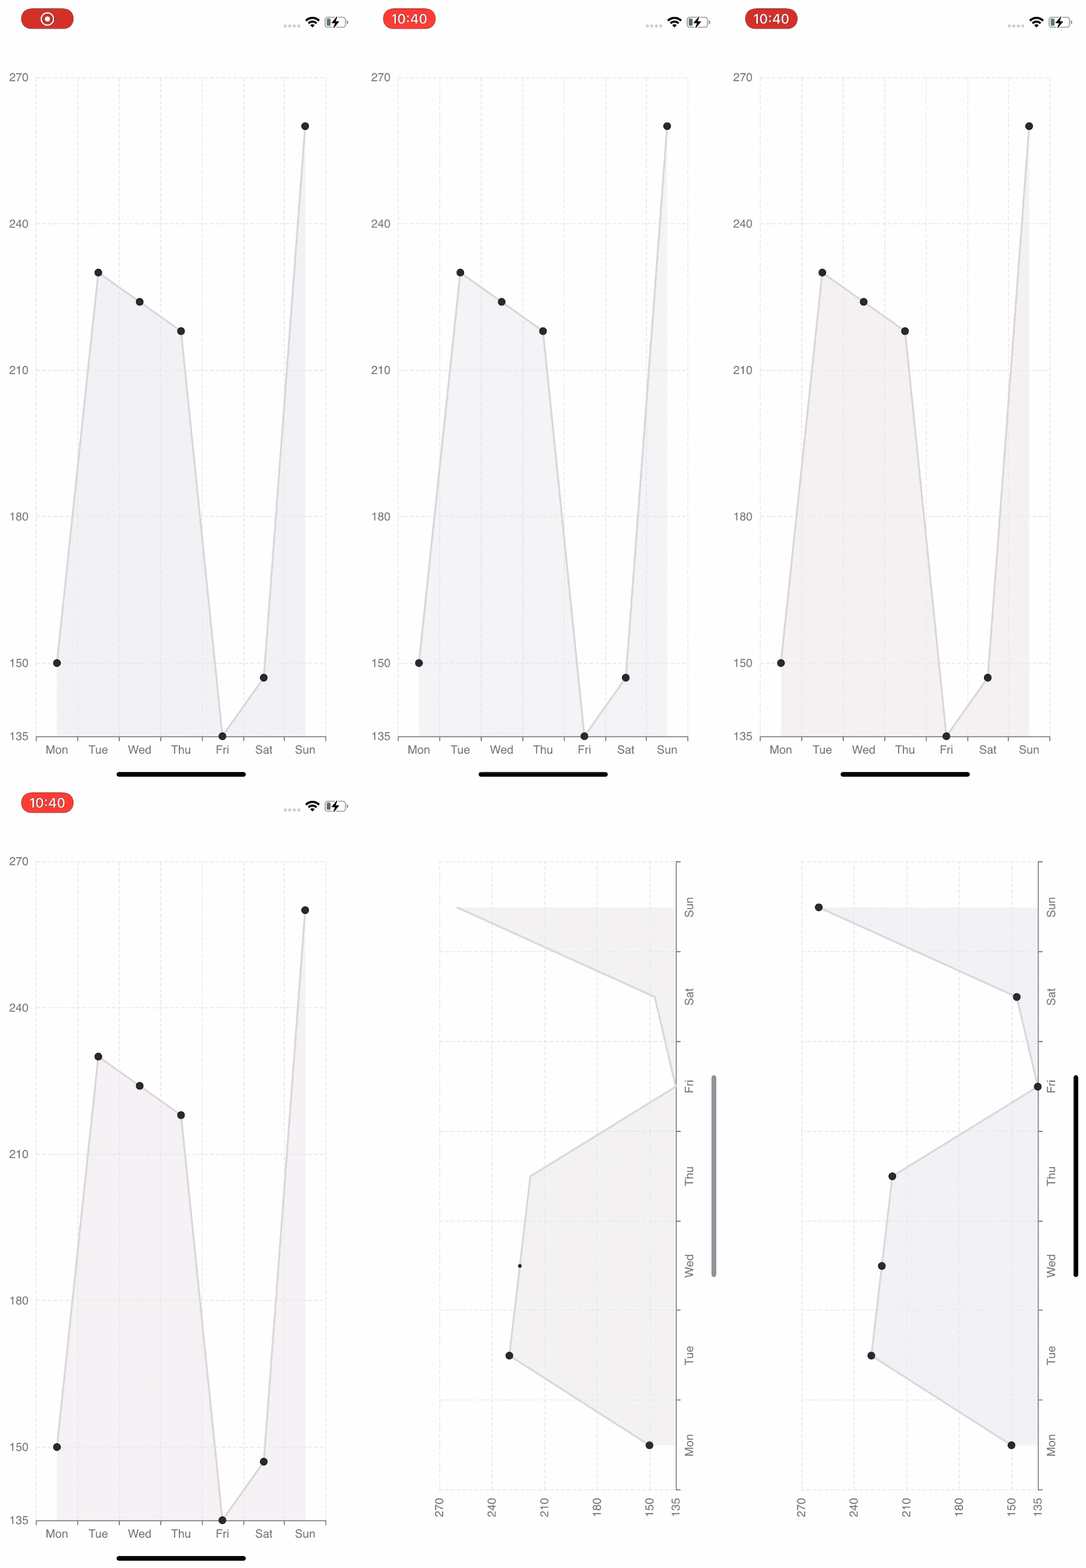
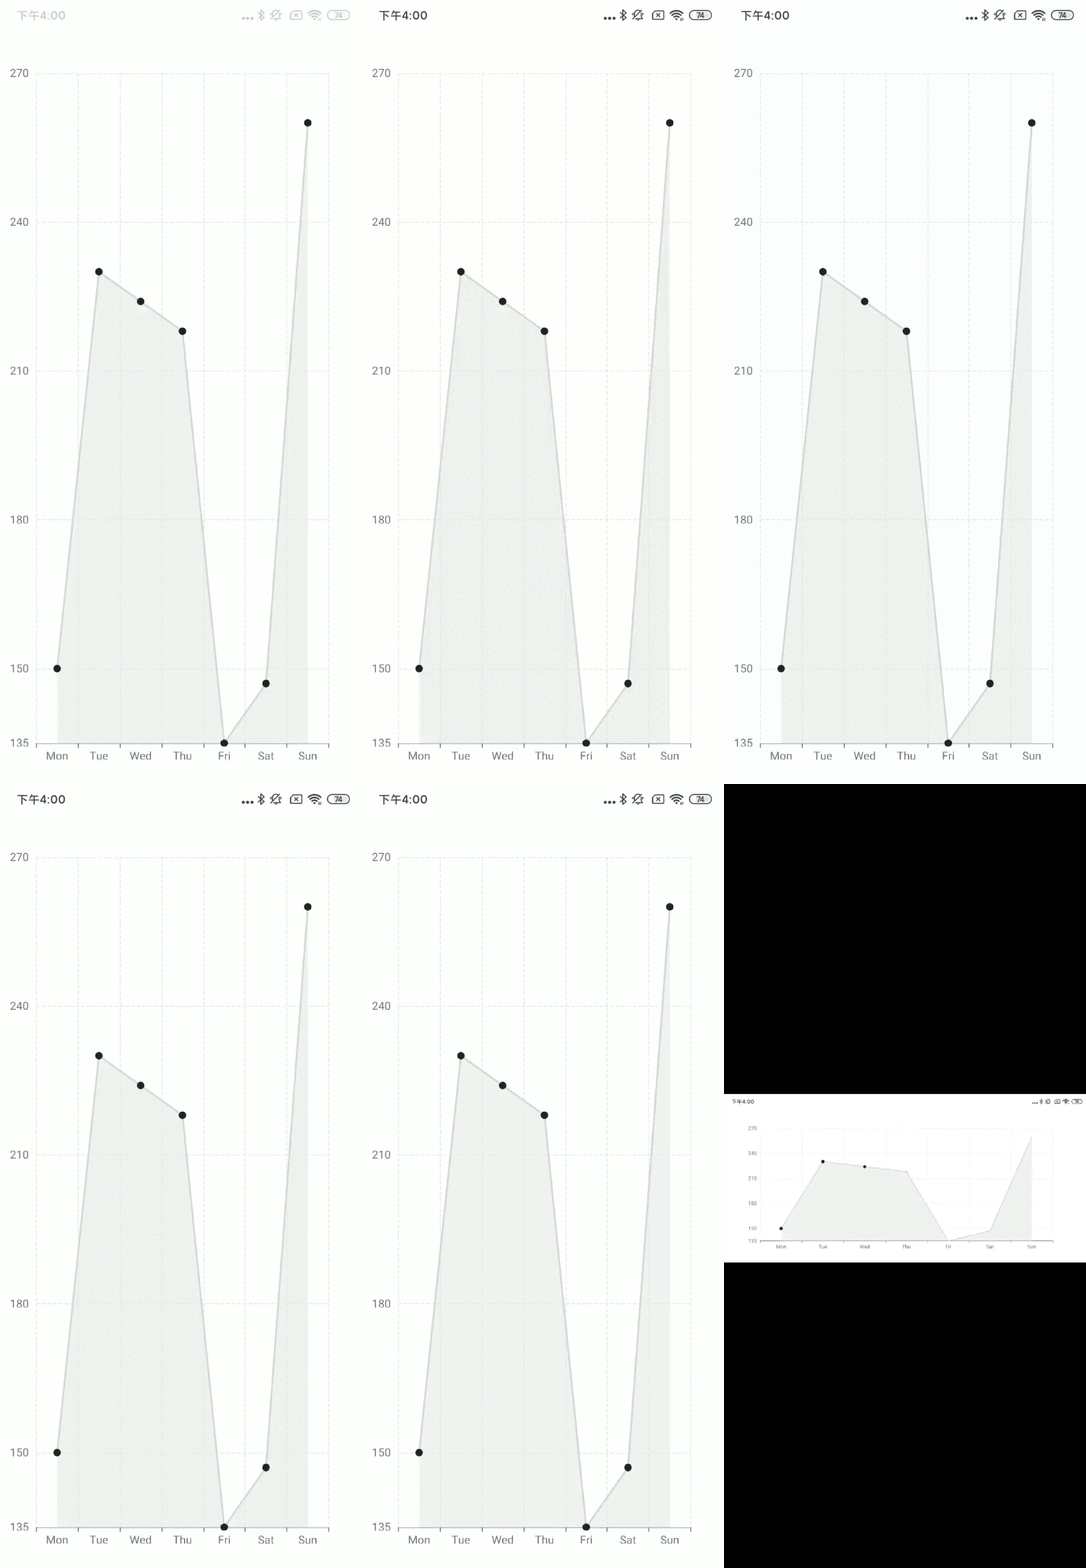
您應該看到以下螢幕:
| iOS | Android |
|---|---|
 |  |
如果您想使用 react-native-svg,只需將 SkiaChart 替換為 SvgChart,然後使用 svg 作為渲染器。
有關更多圖表配置,請參閱 echarts 文件。